
 by
by 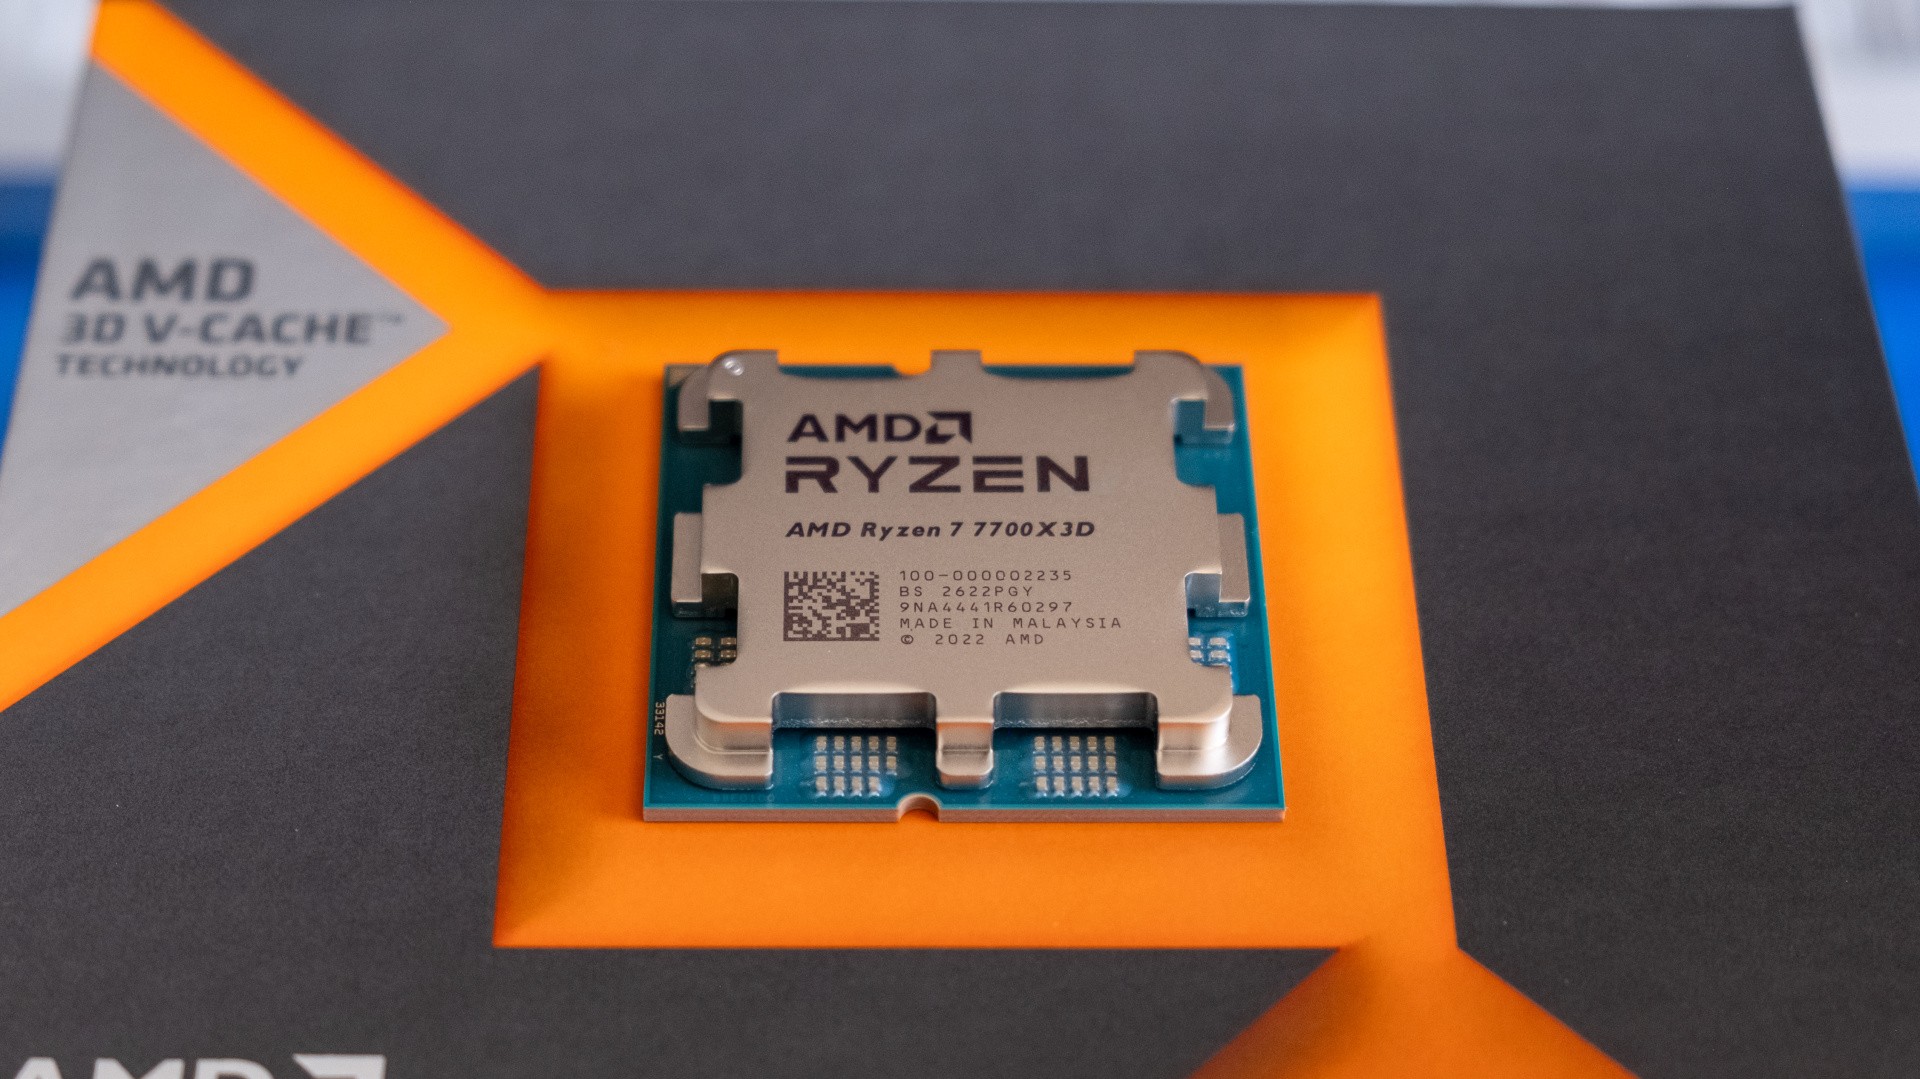
AMD's Ryzen 7 7700X3D is here, promising the exceptional gaming performance of AMD's X3D CPUs at a new lower price of $329/£295.
The 7700X3D is a slightly slower counterpart to the popular 7800X3D, a Zen 5 part with eight cores and 16 threads, matching it spec-for-spec but having a rated base clock that's 200MHz lower and a rated boost clock that's 500MHz lower. With that in mind, we'd hope it delivers nearly the same frame-rates at a lower price.
Does the 7700X3D hit that target - and how big is the gap to the latest-gen 9800X3D? And if you're upgrading from the fastest gaming CPU for the previous AM4 platform, the Ryzen 7 5800X3D, is it worth making the leap to AM5 in the midst of a DDR5 RAM pricing surge?
To find out, we've tested the new 7700X3D against its three closest X3D rivals: the 5800X3D, 7800X3D and 9800X3D. In all, we tested 10 games on each CPU at 1080p resolution, including one new addition to our suite, normally using maxed settings with DLSS performance mode engaged to ensure a worst-case-scenario CPU bottleneck.
We've also added in a selection of content creation benchmarks to get an idea of the performance hierarchy. Here's how the four test CPUs compare in terms of specs:
Model |
CPU Design | Boost | Base | L3 Cache | TDP | Price |
|---|---|---|---|---|---|---|
| Ryzen 7 9800X3D | Zen 5 8C/16T | 5.2GHz | 4.7GHz | 96MB | 120W | $445/£339 |
| Ryzen 7 7800X3D | Zen 4 8C/16T | 5.0GHz | 4.2GHz | 96MB | 120W | $349/£286 |
| Ryzen 7 7700X3D | Zen 4 8C/16T | 4.5GHz | 4.0GHz | 96MB | 120W | $329/£295 |
| Ryzen 7 5800X3D | Zen 3 8C/16T | 4.5GHz | 3.4GHz | 96MB | 105W | $349/£315 |
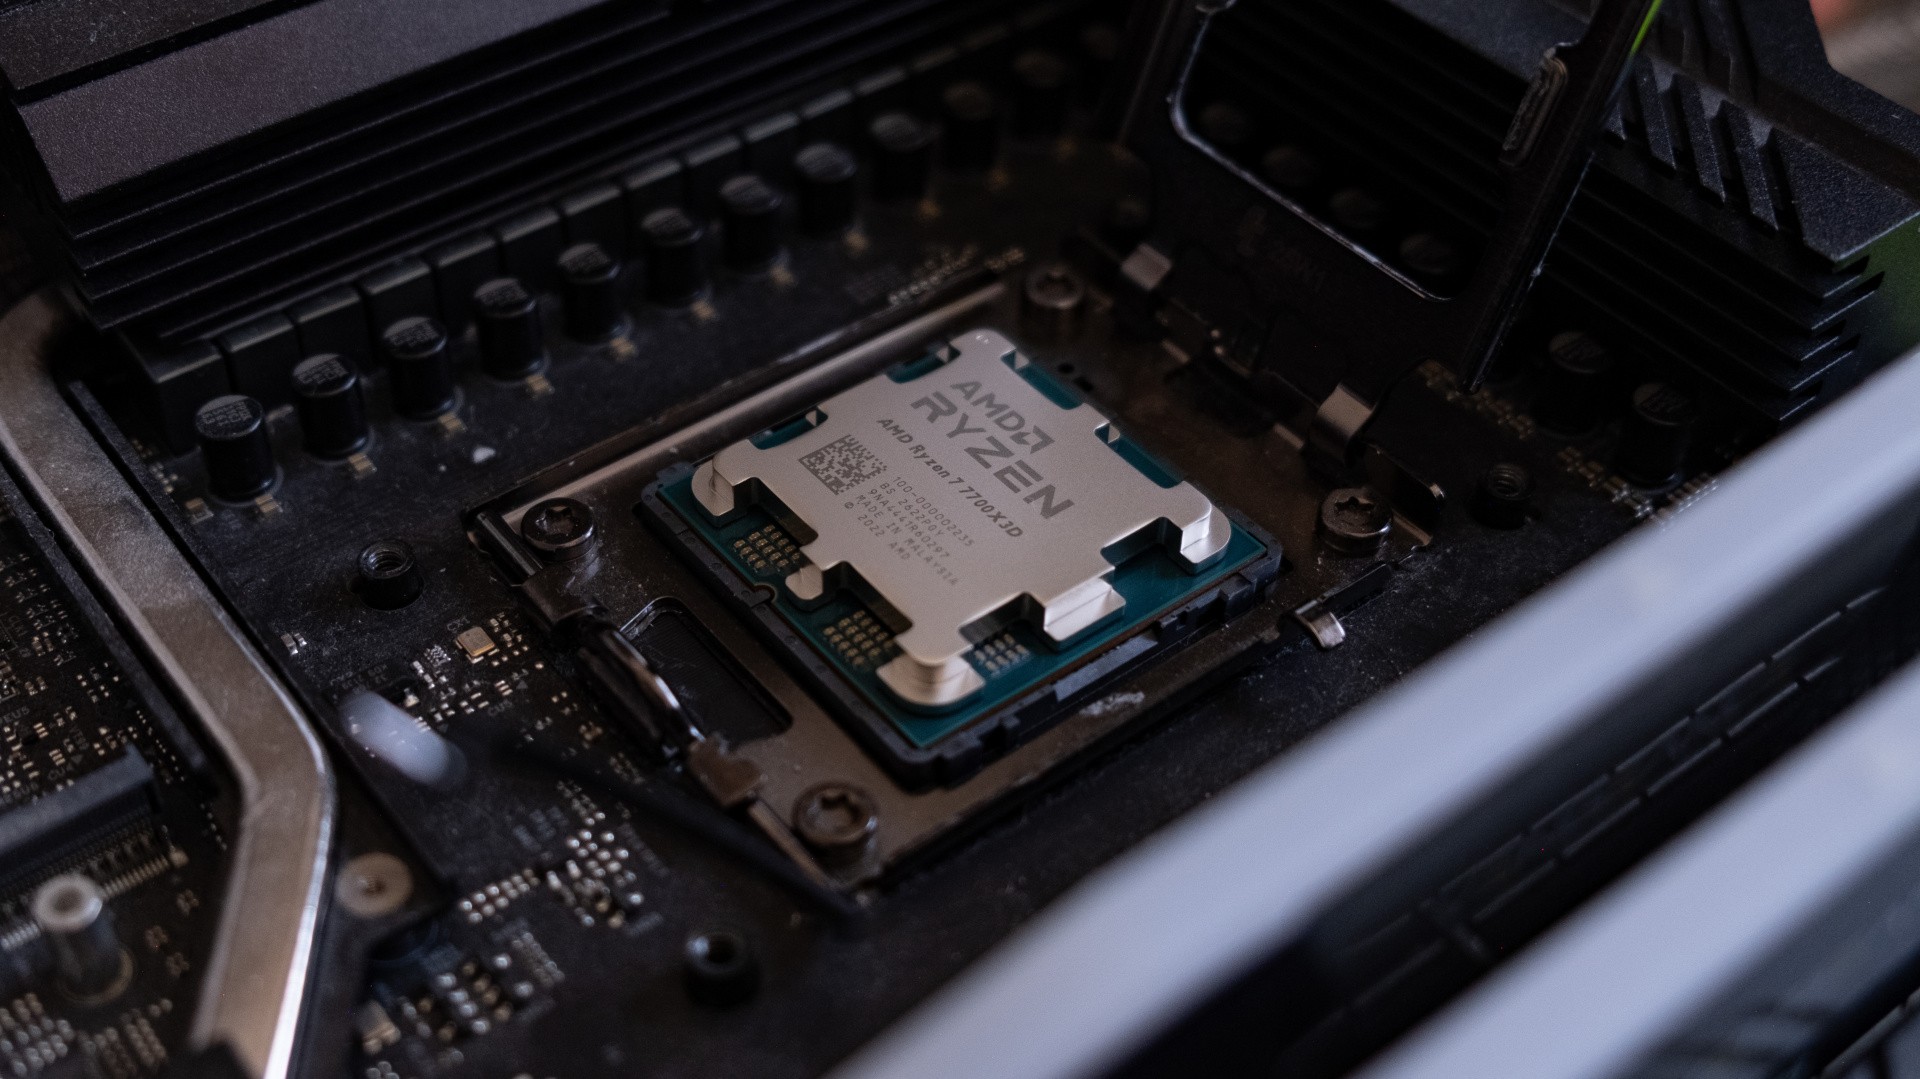
As usual, we're testing the 7700X3D and other AM5 CPUs on our AsRock X670E Taichi test bed, with components including an Nvidia GeForce RTX 4090 Founders Edition graphics card, 32GB of Corsair DDR5-6000 CL30 RAM, a 2TB Samsung 990 Evo Plus SSD and a Corsair RM1000x power supply mounted on an Open Benchtable open air case. Our AM4 testing was performed with an Asus ROG Crosshair 8 Hero motherboard, 2TB Crucial T710 SSD and 32GB of G.Skill DDR4-3600 CL16 RAM.
In terms of software, we're relying on bespoke benchmarks in nine of the 10 tests, running on Windows 11 25H2 with the latest BIOS versions and chipset drivers installed. The graphics driver we're using is Nvidia's 595.97 release.
We normally start with some quick content creation benchmarks which give a basic idea of how the CPU compares when run flat-out on a single core or on a workload that can be easily divided between many cores. Cinebench's 2024 and R20 releases are a 3D modelling test, which sees the CPU render a 3D scene, while our Handbrake test is a bit more practical and measures how quickly the processor can re-encode a short sample video into H264 or H265 (HEVC) codecs.
| CPU | CB R24 (1T) | CB R24 (MT) | CB R20 (1T) | CB R20 (MT) | HB H264 (fps) | HB HEVC (fps) |
|---|---|---|---|---|---|---|
| Ryzen 5 3600X | 77 | 578 | 485 | 3654 | 26.66 | 10.80 |
| Ryzen 7 5800X3D | 95 | 915 | 546 | 5746 | 42.00 | 18.71 |
| Ryzen 9 5900X | 98 | 1171 | 610 | 8393 | 57.59 | 23.83 |
| Ryzen 5 7600X | 114 | 845 | 744 | 5814 | 41.29 | 18.31 |
| Ryzen 7 7700X | 118 | 1127 | 758 | 7609 | 53.27 | 23.65 |
| Ryzen 7 7700X3D | 103 |
1001 |
633 |
6534 |
46.05 | 20.22 |
| Ryzen 7 7800X3D | 112 | 1074 | 688 | 6988 | 49.63 | 21.54 |
| Ryzen 9 7900X | 116 | 1605 | 776 | 11196 | 78.35 | 32.59 |
| Ryzen 9 7950X | 121 | 2004 | 784 | 14272 | 98.58 | 41.68 |
| Ryzen 5 9600X | 132 | 935 | 850 | 6358 | 42.51 | 19.77 |
| Ryzen 7 9700X | 130 | 1172 | 862 | 7851 | 51.80 | 23.79 |
| Ryzen 9 9800X3D | 134 | 1342 | 823 | 8938 | 59.59 | 27.44 |
| Ryzen 9 9900X | 135 | 1784 | 879 | 12617 | 82.96 | 35.33 |
| Ryzen 9 9950X | 138 | 2235 | 866 | 15850 | 103.25 | 44.97 |
| Core i5 14600K | 120 | 1400 | 777 | 9420 | 59.42 | 25.39 |
| Core i7 14700K | 127 | 1987 | 818 | 13614 | 80.26 | 31.07 |
| Core i9 14900K | 133 | 2107 | 875 | 15297 | 85.06 | 35.08 |
| Ultra 5 245K | 128 | 1435 | 841 | 9864 | 61.05 | 26.88 |
| Ultra 9 285K | 144 | 2386 | 895 | 16055 | 97.17 | 38.44 |
The Cinebench results show a lower baseline of performance for the 7700X3D, which is to be expected given its lower rated boost clocks. The chip managed 92 percent of the architecturally identical 7800X3D in the 2024 single-core test, with a similar 93 percent read-out for the multi-core segment. The differential doesn't shift in the R20 release either, which is a bit quicker to run, with temperatures maxing out in the 70s across all four runs.
The Handbrake results are similar, with the 7700X3D scoring between the 7600X and 7700X as the result of its reduced clocks versus the 7700X and 7800X3D. Again, the 7700X3D is delivering around 93 to 94 percent of the faster-clocked 7800X3D part, so we wouldn't expect to see the gap between the two CPUs widen beyond six percent in a completely CPU-limited gaming benchmark.
Speaking of which, let's move onto the benchmarks proper. Our live metrics system isn't quite fully operational yet, so the results are summarised in the gallery below. There are 10 games shown below, and you can use the left/right buttons on desktop or swiping on mobile to see each set of results. Click to enlarge.
In general, there's a two to five percentage point advantage for the 7800X3D versus the 7700X3D, or to put it another way, the 7700X3D manages to deliver around 95 to 98 percent of the 7800X3D's performance. That means its $329 price point is well-judged by AMD, with the 7700X3D being about the same value in terms of frames per dollar while consuming a bit less electricity on account of its lower average clocks. However, the UK pricing doesn't make sense at least at the time of writing, with the £295 RRP being higher than the £286 charged for the 7800X3D. Over time, we'd expect this to shake out to a £10 to £20 discount, analogous to the US pricing.
Judged against the 5800X3D, the maths are more favourable. The 5800X3D is often significantly behind the 7700X3D - delivering 78 percent of the performance in Baldur's Gate 3, 87 percent of the performance in Hitman: World of Assassination and 88 percent of the performance in Crimson Desert, all while costing more - albeit not taking into account the fact that DDR4 RAM for the 5800X3D is cheaper than the DDR5 required by the 7700X3D. However, the gap narrows in some titles too, such as Counter-Strike 2, Flight Simulator 2020 and F1 24, where the gap is anywhere from non-existent to around two percent, showing the 5800X3D is still a capable option in its own right.
In general, the 7700X3D makes a lot more sense for a new build than the 5800X3D, as its much greater upgrade potential is worth the higher initial RAM and motherboard investment, but I wouldn't be rushing out to replace a working 5800X3D system with a 7700X3D one.
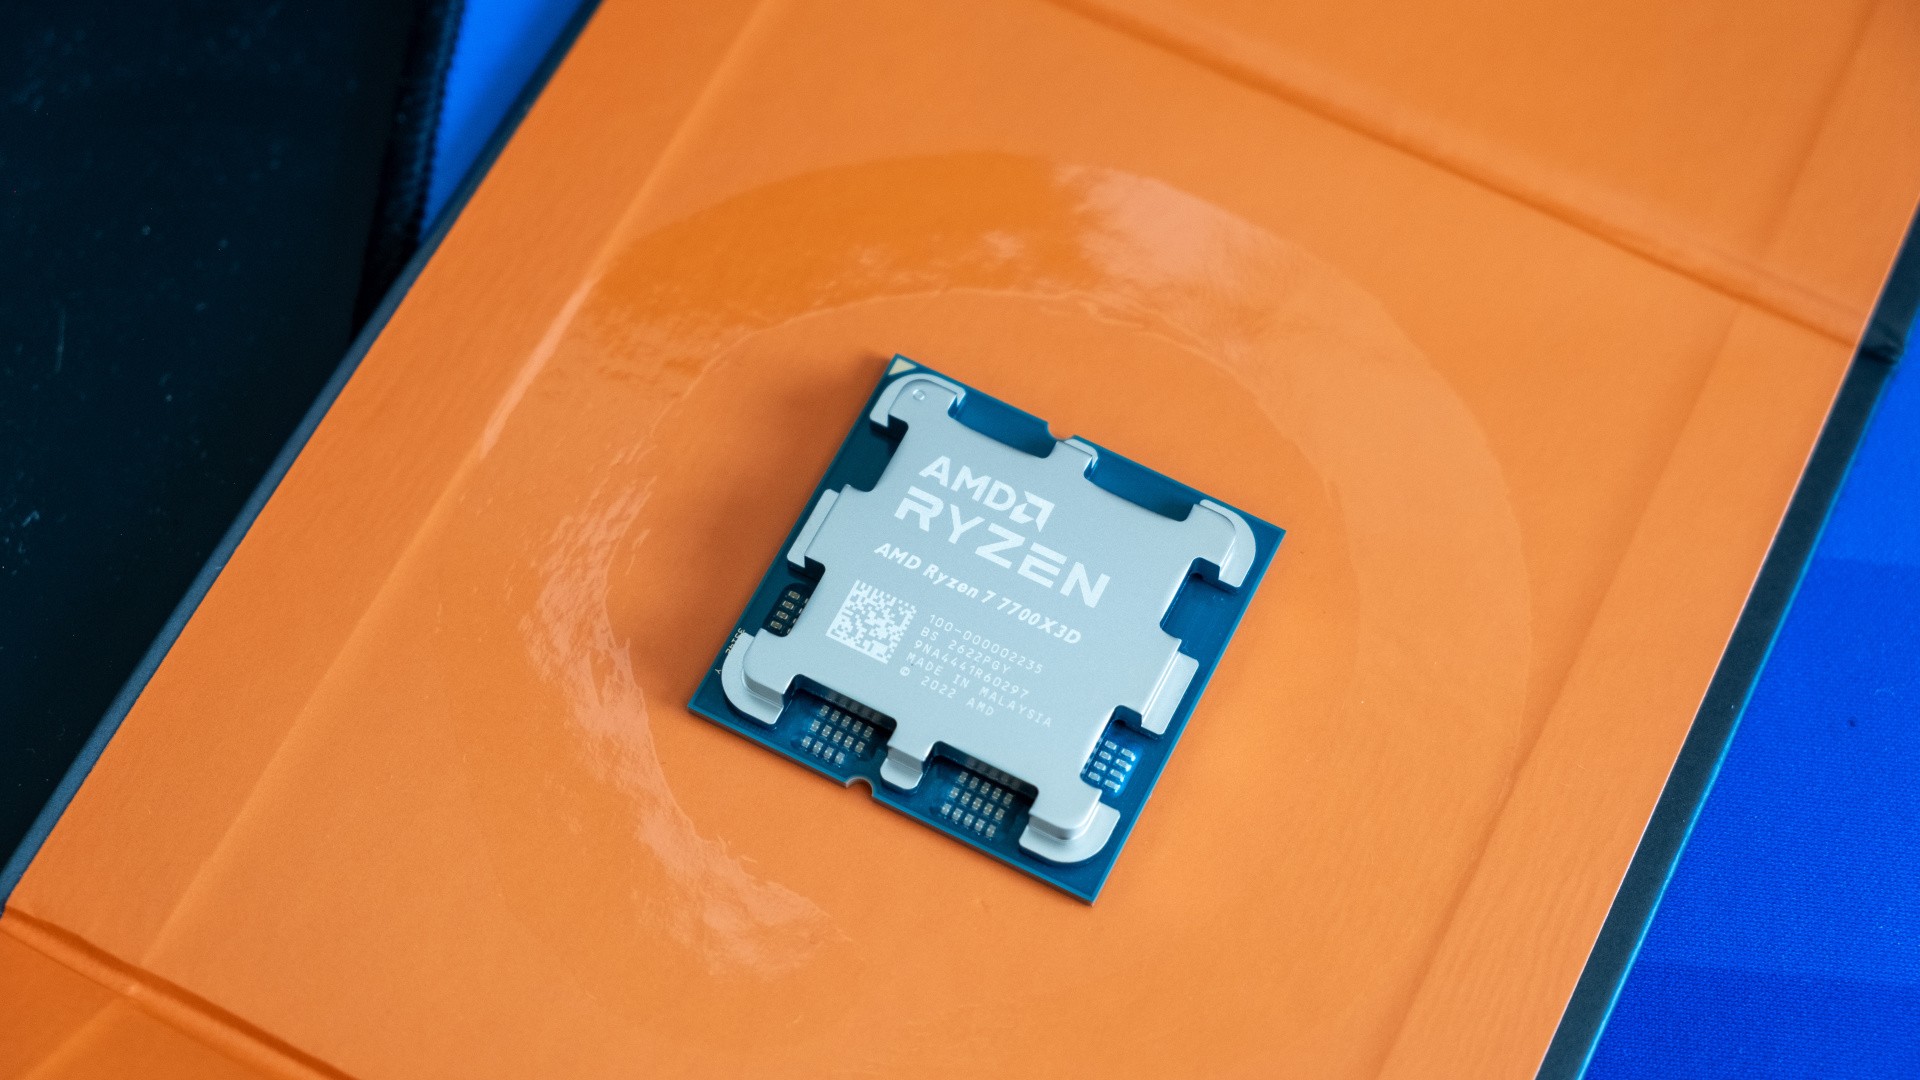
If the 7800X3D and 9800X3D are also within your budget, the 7800X3D is worth paying up to five percent more for its extra performance (eg $349), while the 9800X3D is worth paying up to around 20 percent more (eg $399). However, note that our benchmarks show the absolute worst-case CPU-bound scenarios we could find, and in most cases - and higher resolutions - the cheaper 7700X3D will perform much closer to its higher-tier brethren, making it the new default choice for AM5 gaming CPUs.
As always, we encourage you to read a wide range of reviews, as CPU load and resultant performance can vary greatly between different scenes in the same game, let alone between different games, engines and genres. Only by reading a plurality of published material can you get a broad sense of how good a given processor really is.
Based on our testing, the 7700X3D doesn't exceed expectations, but if it's a way of using up processors that weren't quite good enough to become 7800X3Ds, then that seems fair enough - as long as prices remain competitive. $329 is right on the edge of being a better value versus current Amazon US prices, but current UK pricing sees the 7800X3D the cheaper option - by far if you know where to look. I'm sure that will be corrected over time, but right now UK users are better served by the 7800X3D.